The Power of Visual Representations: Enhancing Mathematical Comprehension for Diverse Learners
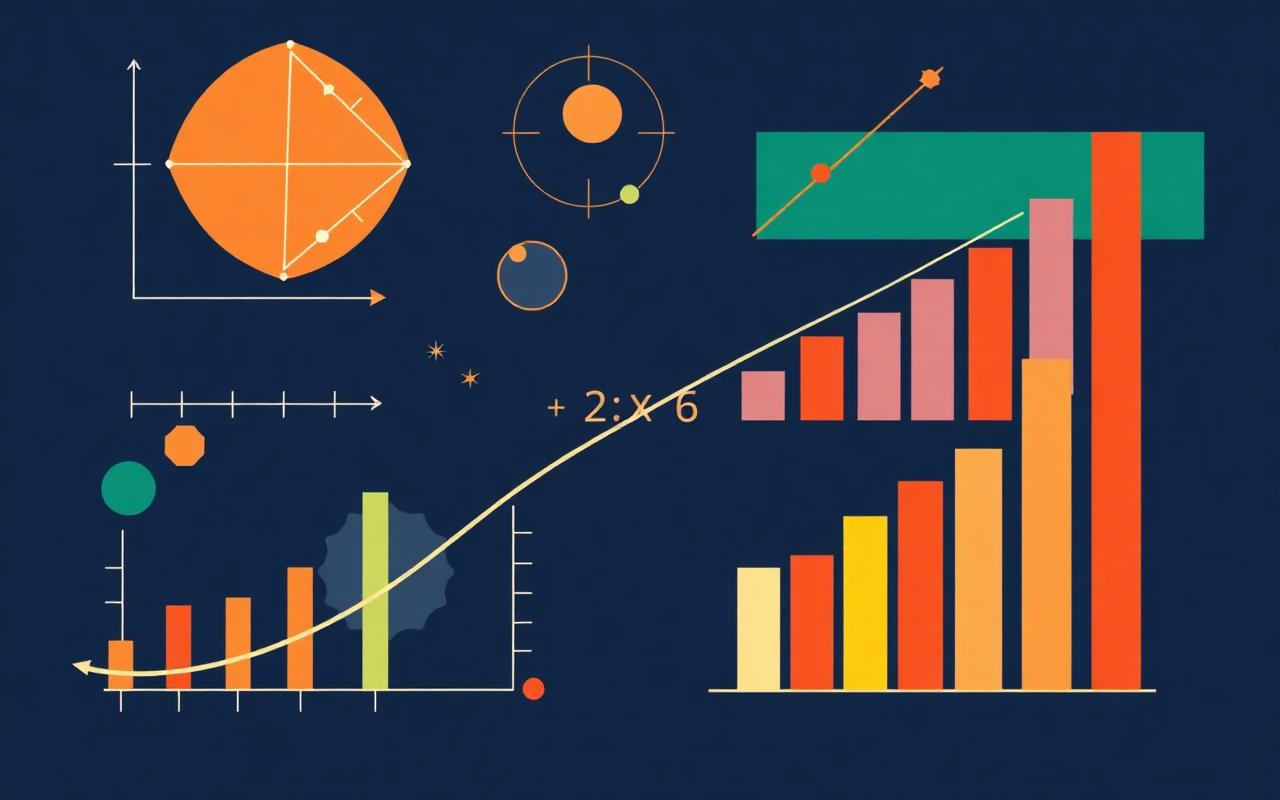
Mathematics is often perceived as abstract and complex. Visual representations bridge that gap — making concepts accessible, meaningful, and inclusive for every learner.
Mathematics is often perceived as abstract and complex, causing many students to struggle. Research indicates that a significant number of students experience difficulties understanding mathematical ideas presented solely through symbolic notation. Visual representations bridge this gap, making abstract concepts more accessible and meaningful.
Visual representations — including diagrams, models, and digital simulations — play a crucial role in math education. By aligning with cognitive processes and diverse learning styles, these tools help students develop a deeper understanding of mathematical relationships. This article explores the cognitive benefits of visual representations, various forms they take, and practical strategies for classroom implementation to support diverse learners.
The Cognitive Benefits of Visual Representations. Studies in cognitive science highlight that the brain processes visual information more efficiently than text or numbers alone. Visual memory and spatial reasoning contribute to stronger retention and understanding, allowing students to form mental models of abstract ideas. Visuals also make abstract concepts concrete: a number line helps students understand negative numbers, while bar models clarify fraction operations. Graphical depictions — like geometric transformations — help students recall information more effectively than memorizing formulas alone. And they support diverse learning styles, benefiting visual and kinesthetic learners while providing inclusive pathways for students with learning disabilities.
Visual Representations in Math: Diverse Forms. Diagrams and models (number lines, bar models, Venn diagrams, geometric shapes) help visualize concepts. Manipulatives (blocks, tiles) make abstract ideas tangible — improving understanding of place value, fractions, and geometry. Technology-based visualizations (interactive simulations, graphing software, dynamic geometry tools) offer engaging, exploratory learning when carefully integrated. And student-created visuals — where learners generate their own diagrams and sketches — reinforce understanding and personalize mathematical exploration.
The Role of Graphic Organizers. Graphic organizers are visual tools that help students represent, organize, and analyze mathematical concepts. Three ways I use them: Fill-in the Blank — students complete an organizer using a provided list of characteristics or examples, solidifying understanding of key concepts (e.g., a Carroll Diagram sorting shapes by attribute). Student-Generated Examples — students fill in a blank organizer with their own examples, encouraging critical thinking and application (e.g., a Frayer Model for "even numbers"). Attribute Identification — students analyze a completed organizer to identify the underlying concept, developing analytical skills (e.g., concept attainment cards for symmetrical figures).
Conclusion. Educators are encouraged to integrate more visual strategies into their teaching practices, fostering a learning environment where all students can thrive. As technology and pedagogy continue to evolve, new visual tools will further enhance the way mathematics is taught and understood. Embracing visuals in math education bridges gaps in comprehension and empowers students to become confident mathematical thinkers.
Keep reading

Math Beyond Memorization: The Power of Provocations
What if every math lesson began with a spark of curiosity instead of a formula? A merged reflection on what provocations are, why they matter, and the key elements that make them transformative.

The Invisible Work That Shapes How Children Learn Math
We often talk about improving math learning by adding strategies and worksheets. But research keeps pointing us back to something deeper — what teachers know, believe, and notice.

Building Critical Thinking Routines: Incorporating Strategies into the Daily Math Classroom
Routines create predictable structure — but the best ones also open the door to critical thinking, mathematical reasoning, and rich discourse.